

The deadly storm that inspired the first weather forecast
It is the morning of 26 October 1859, and the steam clipper Royal Charter is sailing north through the Irish Sea, the final leg of a journey that began two months earlier in Melbourne, Australia. While the ship's 371 passengers mostly stay in their cabins, preparing for their arrival in Liverpool, the crew and their captain, Thomas Taylor, are on deck watching the weather.
It has been an unsettled day so far, with a hazy sky and an oppressive feel to the air, and now the wind has suddenly picked up. Captain Taylor gives the order to lower the mainsails and stoke up the engines as the waves begin to rise.
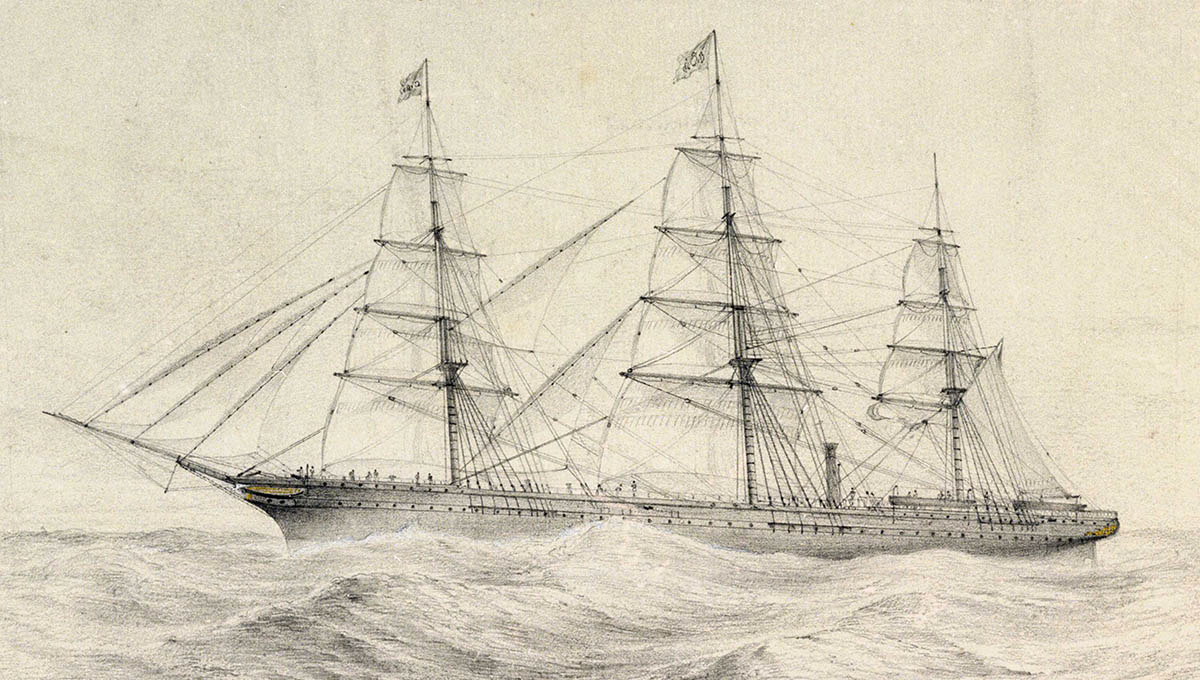
The steam clipper Royal Charter, operated by the Liverpool & Australian Navigation Company. Courtesy National Maritime Museum/Creative Commons.
Unknown to the crew of the Royal Charter, something terrible was bearing down on them. For two days, a network of observers across the UK and in ships on its waters had been writing measurements in ledger-books – barometric pressures, temperatures, wind speeds and directions.
Taken as a whole, these measurements sketched the outline of an approaching "rotatory storm" – what would today be called an extra-tropical cyclone. It had a central pressure of less than 985 millibars and sustained winds of as much as 100 mph (160 km/h) – roughly comparable to a Category 1 or 2 hurricane on the modern Saffir-Simpson scale.
However, the warning provided by these measurements would not be seen by anyone until it was too late.
The storm intensifies
In the early afternoon, the Royal Charter passes the island of Anglesey, the north-westernmost point of Wales. She turns to the east, steaming towards Liverpool and directly into the rising wind. The seas are getting heavier by the hour, and the ship's engine is struggling to make headway.
In the evening, the wind begins to shift, driving the ship south towards the rocky coastline of northern Wales. Captain Taylor orders the crew to drop both anchors and try to hold their position. By now, the sea has been whipped up into mountains of white spray – classified as a twelve on the Beaufort Scale ("Hurricane Force").
For context, this is what Beaufort 11 ("violent storm") conditions look like from the bridge of a modern ship – a vessel significantly larger, more powerful and stronger than the Royal Charter.
The next morning, the papers were filled with news of the storm. There were tales of ships left high and dry on beaches near Liverpool, of fishermen pulled from the sea in Cornwall and of the distant flares of unknown ships swamped by the waves miles from shore. The Royal Charter was noted among the missing, but it was hoped that a large modern ship (it was commissioned in 1855) would have been able to weather the storm.
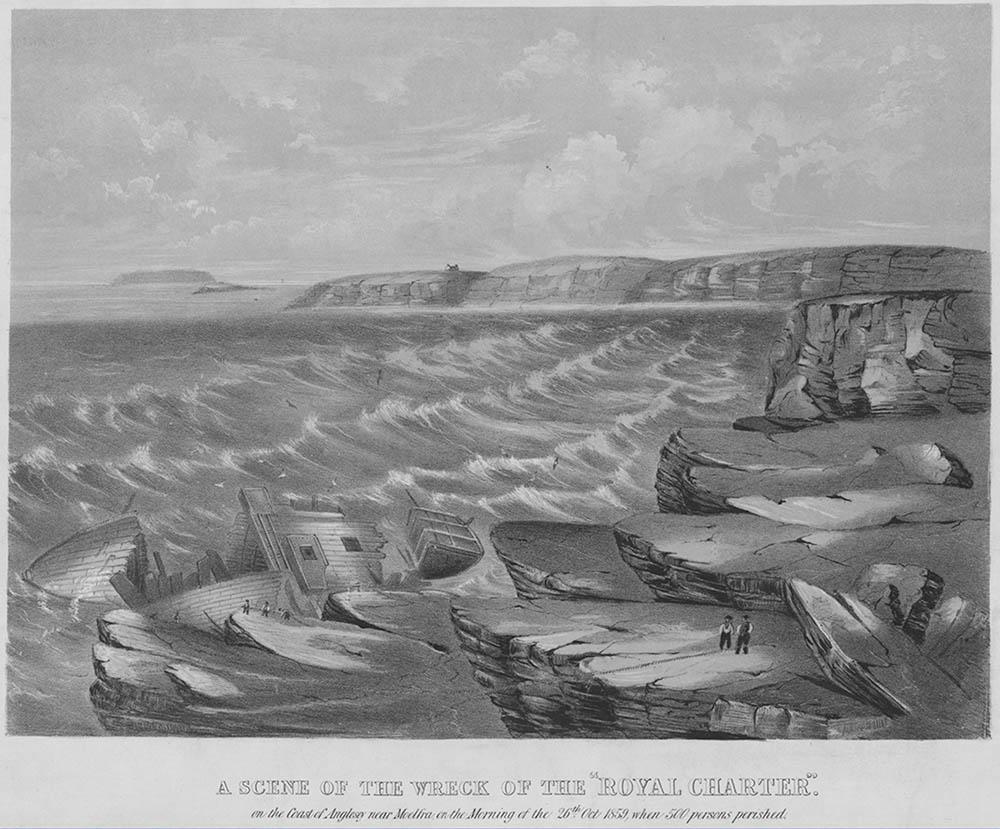
The wreck of the Royal Charter. Courtesy of Llyfrgell Genedlaethol Cymru – The National Library of Wales.
Later in the day, however, news broke of the Royal Charter's fate. Despite running her engine at full power, she had been pushed back towards the shore, dragging her anchors as she went. The force of the wind snapped her masts, then her anchor chains, before smashing the hull to pieces on the rocky cliffs near the Welsh village of Moelfre. Of the 483 people on board, only 39 survived.
It was the worst single incident on a night that saw 133 ships lost in British waters, and an estimated 800 deaths.
The Meteorological Department
While the country was counting the cost of what came to be known as the Royal Charter Storm, a small office in an obscure corner of Whitehall, London, was a hive of activity. Here, three clerks and their boss, Admiral Robert Fitzroy – who between them comprised the entirety of the Board of Trade's Meteorological Department – had been collecting the measurements made by their network of observers in the days prior to the storm.
What they saw was a clear pattern – falling barometric pressure, unseasonably high temperatures and rising winds. From these measurements, they could track the storm as it approached, even estimate its speed (around 20 mph, or 32 km/h). It was a clear confirmation of what Robert Fitzroy had believed for some time – storms could be predicted if the information could be processed in time.
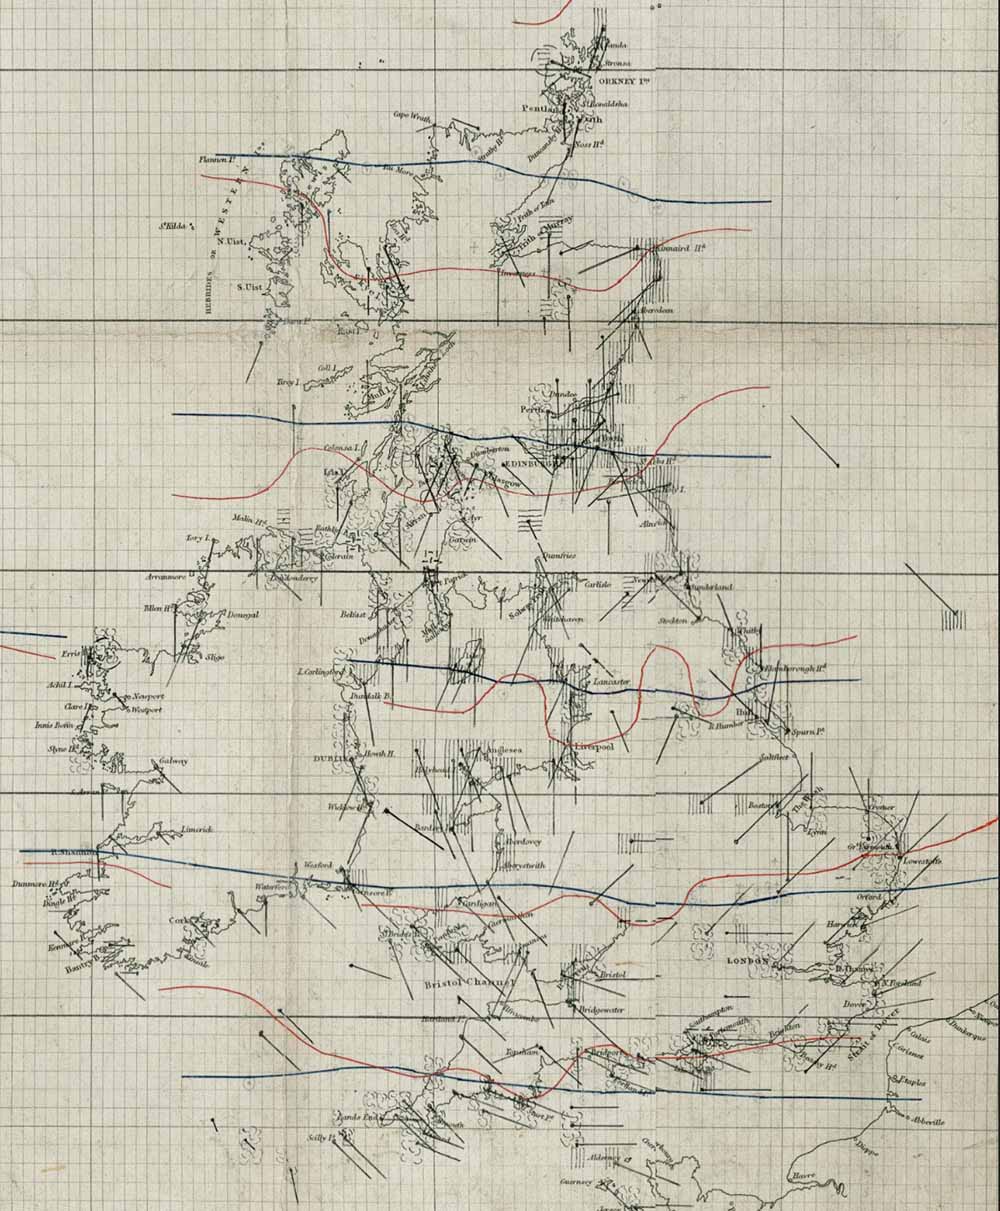
Robert FitzRoy and Thomas Babbington's chart, showing weather conditions on the night of the Royal Charter Storm. The red lines show temperature gradients, blue is barometric pressure. The black lines show measured wind speeds, with the length of the line (originating at its measuring station) showing the strength of the wind.
The Meteorological Statist
Now, there are a lot of ways this could have been handled. Slow deliberative ways, with investigative committees and limited trials and pilot projects. But that wasn't in Robert FitzRoy's nature. Once he was certain that he could warn sailors of approaching storms, he wasn't willing to wait.
FitzRoy had ended up in the Meteorological Department as a consequence of both his achievements and his shortcomings. The son of a wealthy aristocrat, he was an experienced ship's captain, navigator and surveyor; well read in the sciences of the time. However, he could also be aloof, impatient and short tempered, and had spent his career building an extensive portfolio of professional feuds.
The naturalist Charles Darwin, who sailed with him when FitzRoy was captain of the HMS Beagle, remembered FitzRoy as a man of tempestuous moods, brilliant but prone to fits of rage that "bordered on insanity". By the time FitzRoy was offered the role of "Meteorological Statist to the Board of Trade" in 1855, he had been sidelined by the Admiralty and his political career was going nowhere.
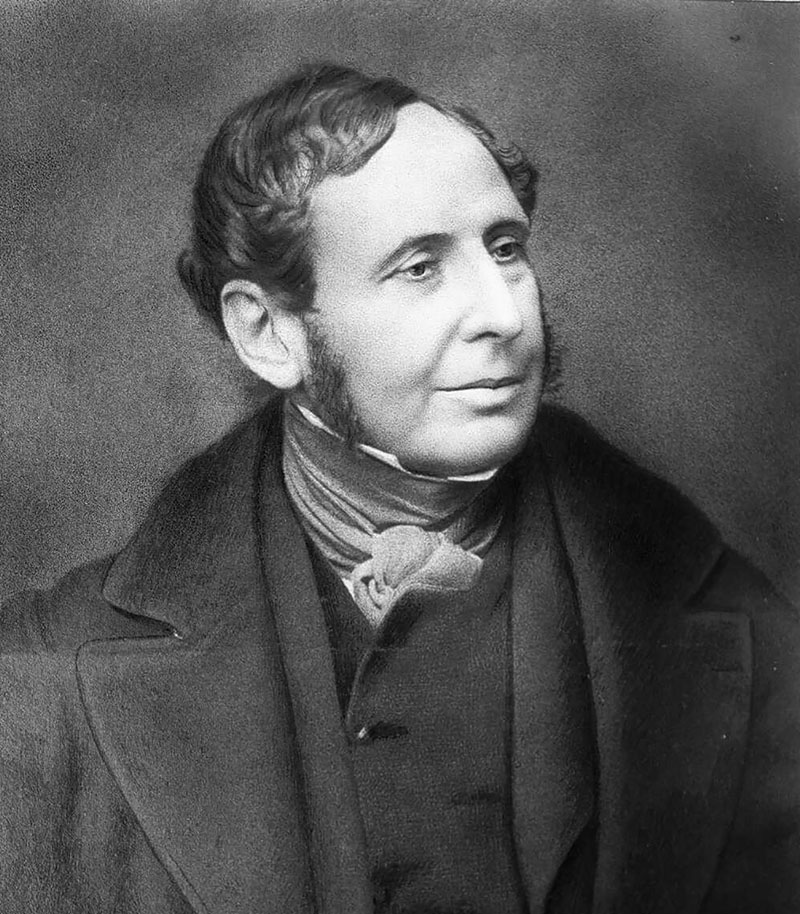
Robert FitzRoy in the early 1850s. Courtesy of the National Library of New Zealand/Te Puna Mātauranga o Aotearoa
In November 1859, FitzRoy went public with his findings about the storm. He wrote letters to newspapers, gave talks and wrote an exhaustive report for the members of the Royal Society (the most prestigious scientific body in the country). Privately he used what political and scientific influence he had to put pressure on the government.
In June 1860, he got what he wanted – funding to update the Meteorological Department's observation infrastructure. Coastal stations were connected by telegraph to allow near-real-time data to be sent to his central office, where his expanded (but still tiny) staff could collate them.
By December 1860, he had 13 telegraph-connected weather stations in the British Isles, and data from another five in France. If the signs of a coming storm were spotted, the same telegraph network could be used to pass warnings to the relevant observation stations, who would distribute them locally and raise signals on masts visible from nearby harbours.
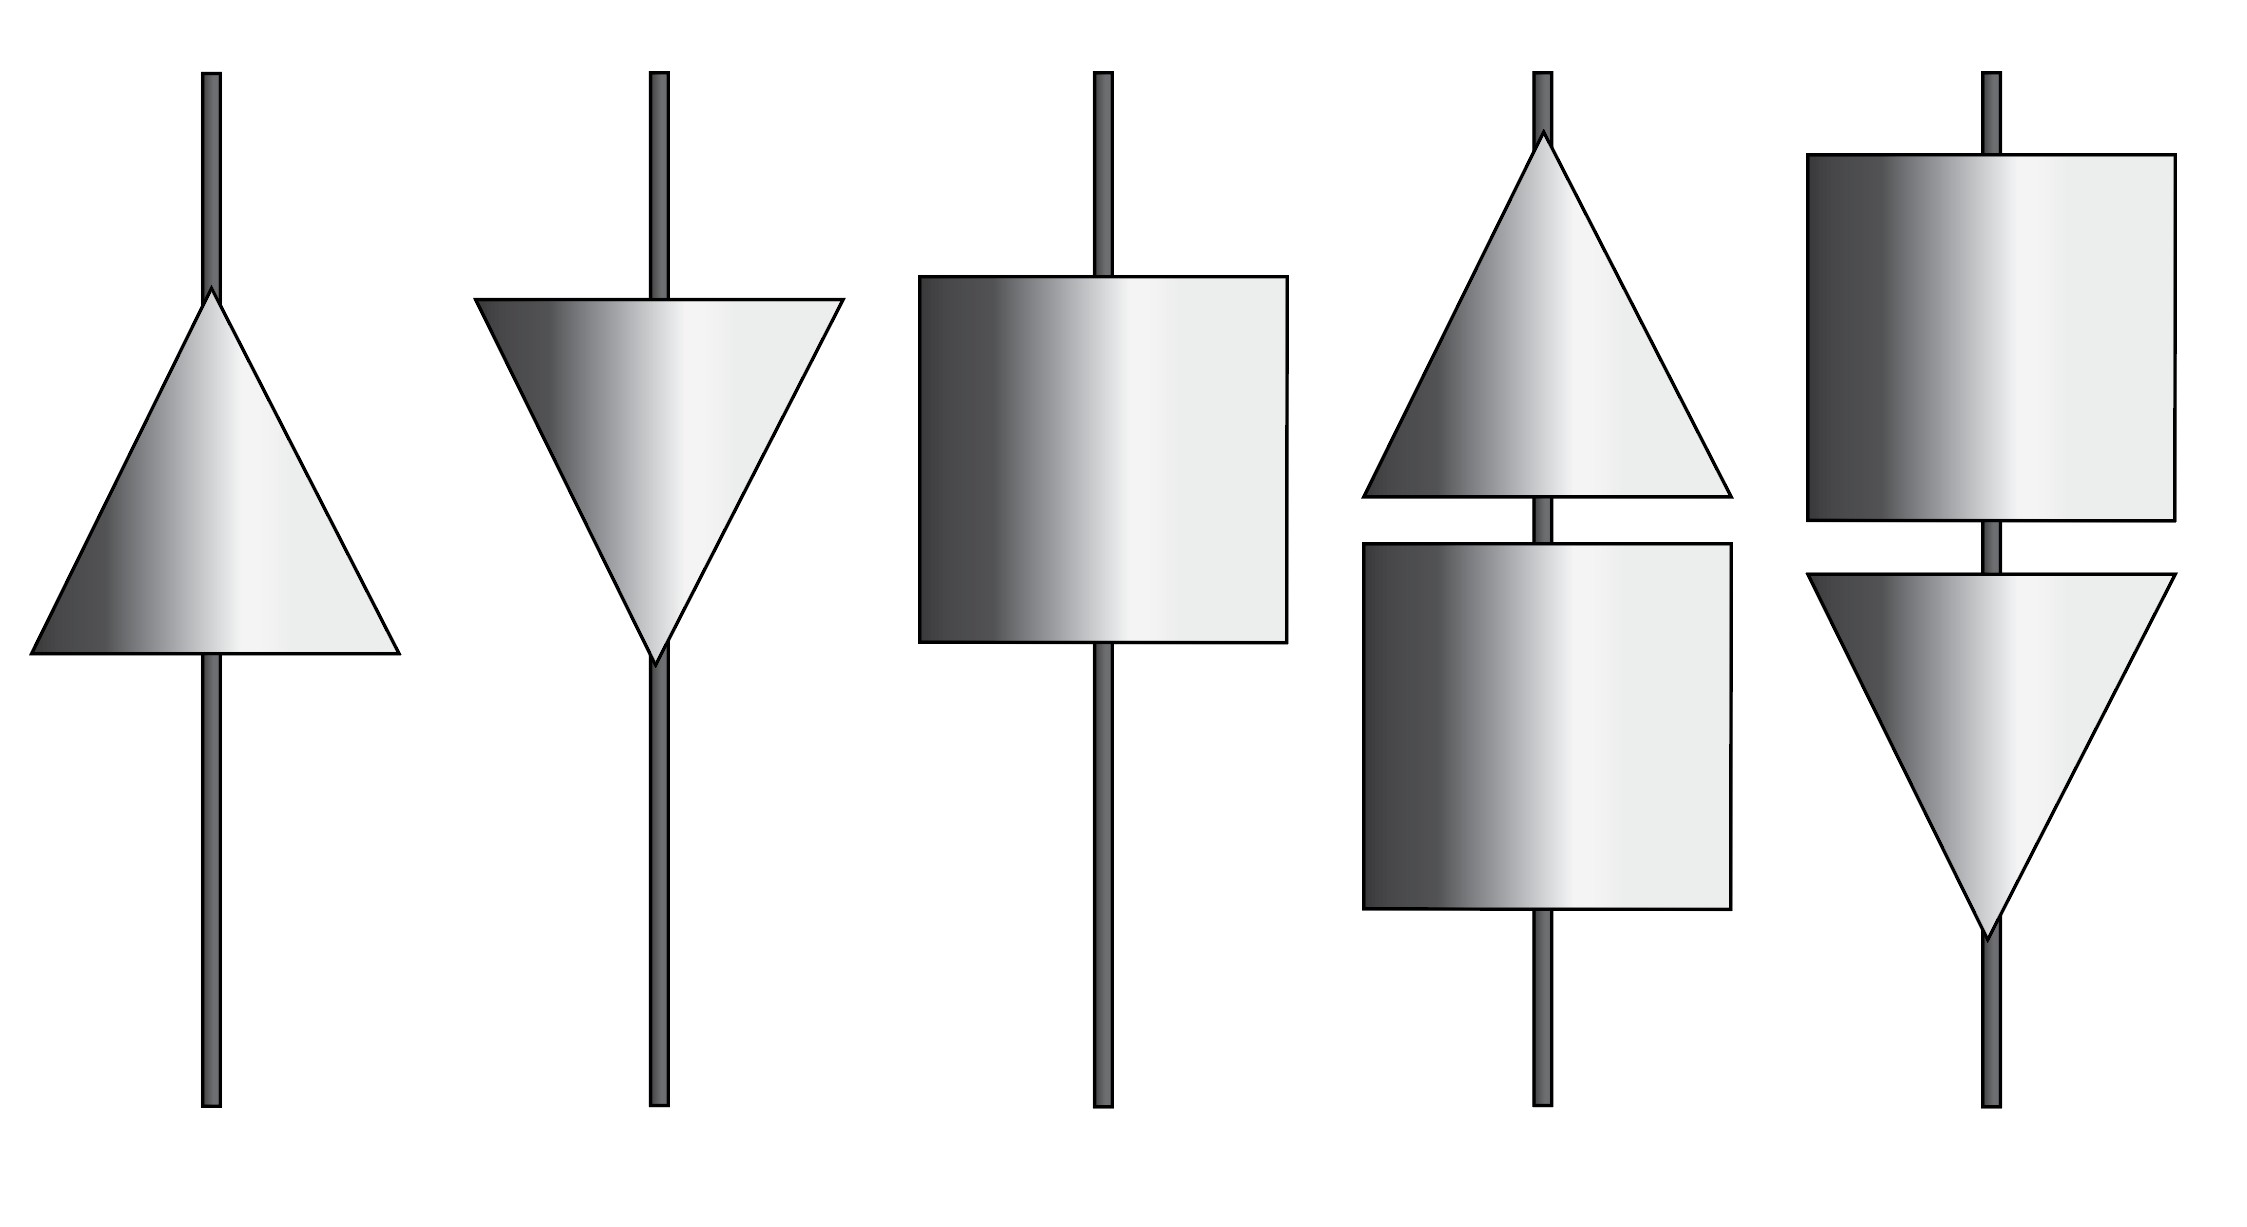
FitzRoy's storm warning symbols, designed to be made from brightly painted wood and hung from a mast in view of shipping. (Left to right) Gale from the south, gale from the north, successive gales, strong winds from the north, strong winds from the south.
All this was, of course, dependent on his department being able to recognize in real time the signs of an approaching storm. These signs had seemed clear in hindsight, when looking at the data from the Royal Charter Storm, but reliably spotting future storms was a far greater challenge.
The process was aided by the five years of observations that had already been collected and plotted on charts. The clerks had meticulously filed these charts with indexes that sorted storms by things like season, direction of origin, initial pressure, etc.
Every morning when the data came in, FitzRoy's two senior clerks, Thomas Babbington and William Pattrickson, would plot it out on a map of the British Isles. These charts would then be cross-referenced against charts of previous weather patterns.
The process of forecasting relied on a mixture of science and intuition, almost more art than science. FitzRoy would consider the trend of the last week or so, the way the patterns matched what they'd seen before, and make an educated guess on what he thought the weather would do next.
The first weather forecast
On 6 February 1861, FitzRoy sent the first message through what was now called the Storm Warning Service. It read simply, "Caution – Gale threatening from south-west, and then northward", and was sent to stations in Aberdeen, Hull, Yarmouth and Dover. The predicted storm swept through the following day, and the majority of the ships lost were from the stretch of the east coast (from Newcastle to Whitby) not yet covered by his new telegraph warning service.
With the exception of a brief period of disruption in 1866–67, these vital foul weather warnings have been produced continually for more than 164 years, making them the longest running weather forecast. Today they take the form of the nightly Shipping Forecast, compiled by the UK Met Office (the present-day descendant of the Board of Trade Meteorological Department) and broadcast on BBC radio.
Read about this and more amazing weather records in Guinness World Records 2026 - on sale now.
Header image: Clearing Up – Coast of Sicily by Andreas Achenbach (1847). Courtesy of the Walters Art Museum/CC-Zero.